J. Biosci. Public Health. 2025; 1(1)
ABSTRACT This cross-sectional study examined the disparities in food security and nutritional status among 500 children and adolescents (aged 5-17 years) in urban slums of Bangladesh. Data were collected from April to June 2024, assessing sociodemographic factors, food security using the Food Consumption Score (FCS), and nutritional status via Body Mass Index (BMI). Results revealed alarming levels of undernutrition, with 56.4% underweight (BMI <18.5) and 47.4% exhibiting borderline food consumption. Severe food insecurity affected 49% of participants, while only 21% achieved acceptable FCS levels. Significant associations were found between food security and parental education, family income, and employment (p < 0.001). Higher maternal education and income correlated with improved FCS, whereas larger family sizes and unemployment were linked to poorer outcomes. School attendance also positively influenced nutritional status. The study highlights a critical double burden of malnutrition, with undernutrition predominant and emerging overweight concerns. These findings underscore the need for targeted interventions addressing socioeconomic determinants, such as enhancing parental education, income-generating opportunities, and school-based nutrition programs, to improve food security and health outcomes in urban slums.
Food security refers to consistent access to sufficient, nutritious, and safe food obtained through economically viable and socially acceptable means, supporting a balanced and healthy lifestyle. [1]. Approximately 2.33 billion people globally suffered from moderate to severe food insecurity in 2023. Moreover 864 million of them experienced extreme food insecurity, frequently being without food for a full day or longer. One in eleven people worldwide was hungry, and in Africa, that number climbed to one in five. There are apparent regional variations: hunger is still on the rise in Africa, where it affects 20.4% of the population; it is stable in Asia at 8.1%, despite the fact that the region retains the majority of the world's hunger burden; and it has started to improve in Latin America, where it has decreased to 6.2%. By 2030, 582 million people-half of whom would be in Africa-are predicted to suffer from chronic undernutrition if current trends continue [2, 3].
Therefore, the health sector-particularly the field of public health-is increasingly focused on food safety and security, as ensuring proper food security can significantly enhance an individual's overall health and well-being. Inadequate availability of food can lead to malnutrition [4]. Food insecurity is one of the primary causes of malnutrition, leading to nearly three million deaths annually [5]. Food scarcity can lead to hunger and undernutrition, which may result in conditions such as wasting, stunting, and compromised immune function [6]. Therefore, food security should be addressed at the local, national, and household levels to meet individualized dietary needs. Inadequate food availability can lead to malnutrition, which may have both immediate and long-term effects on an individual’s health and well-being. One common indicator of chronic malnutrition is stunting. Malnutrition occurs when the body does not receive adequate nutrients required for proper growth, development, and function [7,8]. Food security has long been a critical concern for humanity, but its systematic assessment is a relatively modern development, driven by advancements in technology and scientific research. While poverty and food shortages are often conflated, they represent distinct challenges. Food insecurity arises not merely from insufficient food production but from a lack of social and economic access to adequate nutrition [9]. Empirical studies highlight that marginalized populations frequently face food insecurity due to financial constraints, inequitable distribution systems, and structural barriers to accessing nutritious food [10]. Addressing these disparities requires comprehensive policies that integrate economic, agricultural, and social interventions [11].
Adolescence is a unique stage in the lifespan cycle. Throughout this time frame, individuals gain substantial quantities of their height, weight, and bone density. Therefore, increased food intake for adolescent nutrition is crucial for development, pubertal growth, and for lowering the risk for long-term disorders later in life. Adolescents account for more than 19 percent of the worldwide population and have significant dietary challenges, particularly in underdeveloped countries [12]. Food insecurity can damage adolescents' psychological, interpersonal, and physiological well-being. BMI are widespread in both underdeveloped as well as developing nations [13]. The malnutrition landscape in Bangladesh, particularly concerning adolescents. It highlights that while stunting remains high (29%), there's also a significant prevalence of underweight (56%), and a notable, though smaller, presence of overweight (7%) and obesity (2%). Malnutrition is one of the leading factors for low school enrollment, high absenteeism, early abandoning their studies, and poor academic achievement [14].
Bangladesh’s rapid urbanization has led to rising population density, forcing a growing segment of the population into urban slums characterized by poverty, overcrowding, and limited access to basic services [15]. School-aged children and adolescents in these communities face severe food insecurity and malnutrition, adversely affecting their physical growth, cognitive development, and academic performance [16].
Despite notable advancements in food and nutrition security, food insecurity still exists in Bangladesh, especially for disadvantaged groups. Severe and moderate food insecurity rates appear to have slightly decreased recently, while there are still significant challenges to overcome, particularly in urban and rural areas. The Bangladesh Bureau of Statistics (BBS) reported that the prevalence of severe and moderate food insecurity has also declined to 21.91%, compared to 32.2% in 2014-2016. The prevalence of food insecurity was 24.12% in rural areas, compared to 20.77% in urban areas [17]. There has been no study conducted to measure the association of nutritional status and food insecurity with socioeconomic factors of the slum dwelling school age group (5-17Years). Nutritional status has always been a concern for under five children in slum areas [18, 19].
This study shifts the focus from traditional perspectives and highlights the multifactorial nature of nutritional status and food security, identifying key determinants such as age group, monthly family income, and parental education level. By assessing both nutritional status and food security among slum-dwelling children and adolescents, the study aims to uncover actionable insights for effective interventions. Addressing these disparities is crucial not only for improving immediate health outcomes but also for fostering long-term socioeconomic development. This study offers evidence-based guidance for targeted policies to improve the well-being of vulnerable populations in Bangladesh's urban slums.
Study Design
This is a cross-sectional study that is designed to show the prevalence of food security level among the school-aged children and adolescents living in the slums of Dhaka city corporation area of Bangladesh. The study population for this research is school-aged both male and female, who ages 5 to 19 and currently reside in the slums of Dhaka, Bangladesh. Data were collected from April to June 2024.
Sample Size Calculation
The sample size was calculated using the following equation:

Here,
n = number of samples
z = critical value of the normal distribution
p = expected prevalence estimate
q = (1-p) = expected non-prevalence
d = precision limit or proportion of sampling error
The critical value (z) included as 1.96 for a 95 % confidence level. We made the best assumption for calculating the sample size, the prevalence estimate would be 50%. The precision limit or proportion of sampling error (d) is usually considered to be 5% confidence limit.
Therefore,
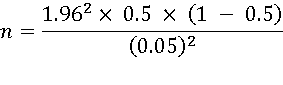
n≈384
A total of 500 children and adolescents are taken as a sample which represents the population.
Data Collection
The respondents who agreed to participate in the study were asked the enlisted questions of the questionnaire and the data collectors recorded the responses in a given pre-tested printed questionnaires at random. All questionnaires were interviewer-administered, and respondents received full assistance. To determine the acceptability and clarity of the questionnaire, 15 people participated in a pilot test. After the pilot, few minor changes were made.
Socio-Demographic Information
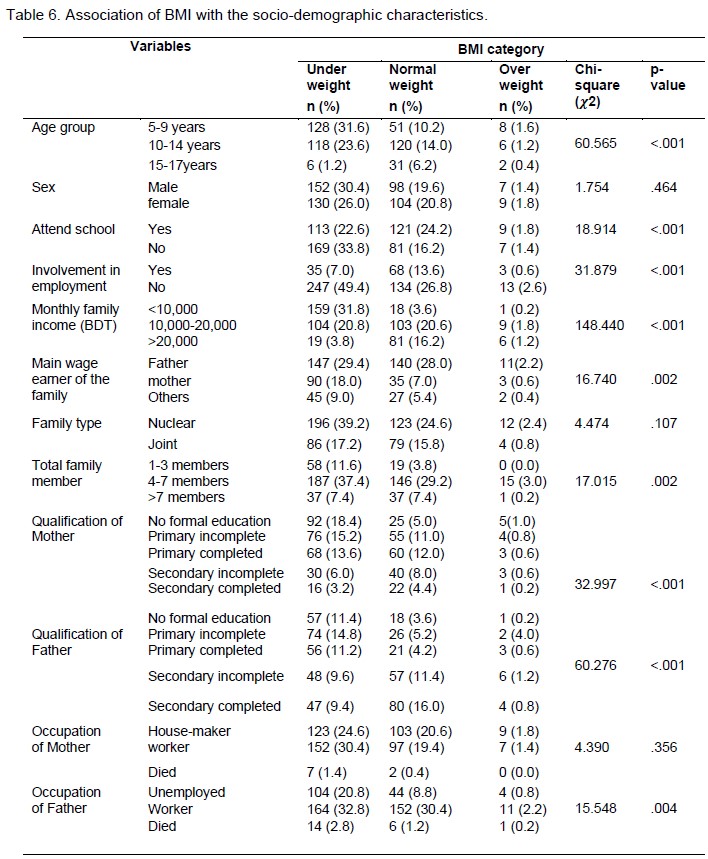
The socio-demographic information obtains various socio-economic and demographic information about the target population including- age group (children (5-9 years), early adolescents (10-14 years) and late adolescents (15-17years); sex (male and female); school attendance (yes or no); involvement in any kind of employment (yes or no); monthly family income (<10,000 BDT, 10,000-20,000 BDT and >20,000 BDT); primary wage earner of the family (father, mother and others); type of the family (nuclear or joint); total number of family members (small 1-3 members; medium 4-7 members; and large >7 members); qualification of the mother (no institutional education, primary level incomplete, completed primary, secondary level incomplete and completed secondary); qualification of the father (no institutional education, primary level incomplete, completed primary, secondary level incomplete and completed secondary); mother’s occupation (housewife, worker, not-alive) and father’s occupation (unemployed, worker, not-alive).
Food Security Level Measurement
Food security levels in this study were assessed using two established methods: the perception-based approach and the Food Consumption Score (FCS). The perception-based method categorizes food insecurity into three levels-normal, moderate, and severe-based on responses to three key questions: (i) whether the respondent consumed three meals per day; (ii) whether they experienced anxiety about food availability for the following day; and (iii) whether they had to reduce meal frequency or went to bed hungry. Responses were captured on a four-point Likert scale: never, rarely, sometimes, and very often [20].
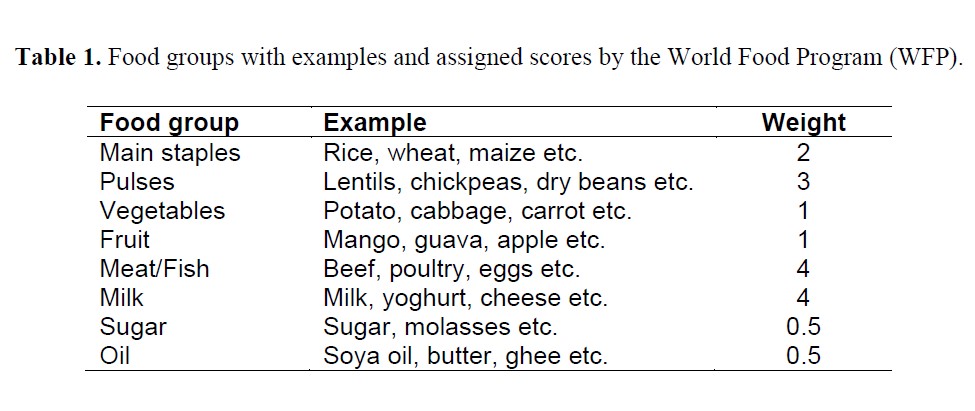
The Food Consumption Score (FCS), developed by the World Food Program (WFP) in 1996, is a standardized metric used to assess household-level food security. It accounts for the diversity and frequency of food group consumption over the preceding seven days, assigning weights to eight food groups based on their relative nutritional value (Table-1). The frequency of consumption of each food group is multiplied by its corresponding weight, and the sum of these products yields the FCS. Based on WFP-defined thresholds, households are then classified into one of three categories: poor, borderline, or acceptable food consumption [21].
Based on the calculated Food Consumption Score (FCS), households were categorized into three groups: poor consumption (FCS ≤ 21), borderline consumption (21 < FCS ≤ 35), and acceptable consumption (FCS > 35).
Nutritional Status Measurement
To assess the nutritional status of the study population, anthropometric measurements including height (in meters) and weight (in kilograms) were obtained using standardized procedures. Growth assessment for school-aged children and adolescents was conducted following the World Health Organization (WHO) recommended reference standards. Based on these measurements, Body Mass Index (BMI), weight-for-age, and height-for-age indices were calculated. BMI was computed as weight in kilograms divided by height in meters squared (kg/m²). Nutritional status based on BMI was categorized as follows: underweight (BMI < 18.5), normal weight (BMI 18.5–24.9), overweight (BMI 25.0–29.9), and obese (BMI ≥ 30.0). In addition, BMI-for-age percentiles were used to classify nutritional status specific to age and sex: underweight (< 5th percentile), normal weight (5th–85th percentile), overweight (85th–95th percentile), and obesity (≥ 95th percentile). Height-for-age percentiles were also assessed to determine linear growth: children with height-for-age below the 5th percentile were categorized as having stunted growth, while those above the 5th percentile were considered to have normal growth [22].
Inclusion and Exclusion Criteria
To be eligible to take part in this study, individuals had to fulfill the following criteria. Being a child or adolescent within the age group of 5 to 18. Living in the slum areas of the Dhaka city. Having the willingness to respond to the survey. The exclusion criteria of the present study included as follows: Being <5 or >18 years old. Incomplete survey. Blank submitted response.
Data Analysis
Descriptive statistics (e.g., frequencies, percentages, means, standard deviations) and some first order analyses (e.g., Chi-square tests) were performed. Variables that significantly differed in bivariate analysis were included in multivariate regression analysis and reported as the adjusted odds ratio (AOR) with 95% confidence interval (CI) for adjusted. All data were analyzed using two statistical software packages (Microsoft Excel 2021 and IBM SPSS Statistics version 25).
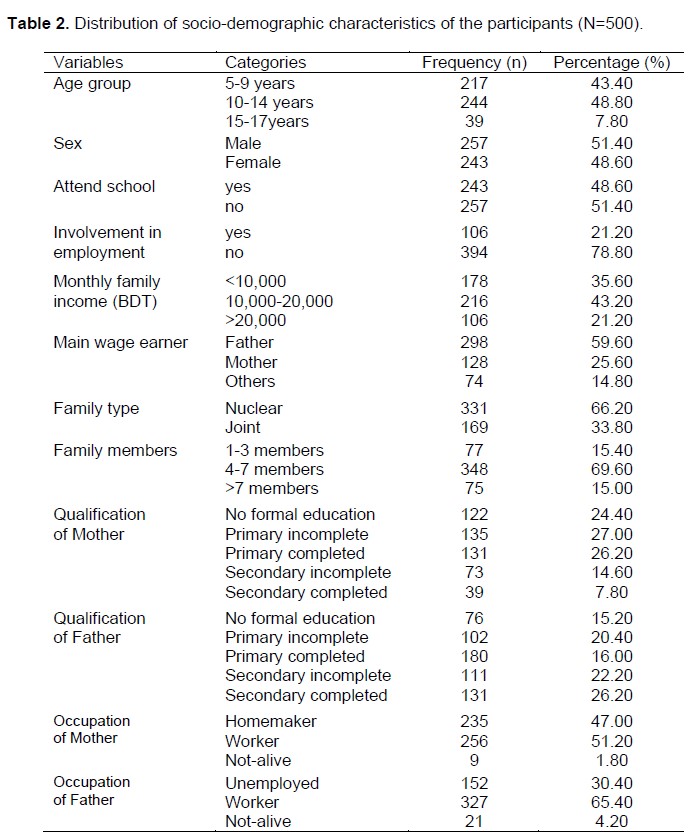
Table 2 presents the distribution of socio-demographic characteristics among the study participants (N=500). The table provides a comprehensive overview of key demographic variables, which may include age, gender, ethnicity, education level, occupation, and other relevant socio-economic indicators. A majority of the participants were female (59.6%), while 40.4% were male. The participants’ ages ranged from 10 to 19 years, with 51.4% classified as adolescents (aged 15–19 years) and 48.6% as children (aged 10–14 years). In terms of education, 50.6% of the respondents had primary-level education, followed by 38.2% with secondary education and 11.2% with no formal education. Regarding family size, most participants came from families with 5–6 members (48.2%), while 26.8% had 3–4 members, 18.8% had more than 6 members, and only 6.2% belonged to families with 1–2 members. The monthly household income of the participants varied considerably. Nearly half of the participants (49.8%) reported a monthly family income between 10,001–15,000 BDT, followed by 31.2% with income ≤10,000 BDT, and 19.0% with income above 15,000 BDT. Among the 500 participants, the primary wage earner in most households was the father (59.6%), followed by the mother (25.6%), and other family members such as siblings or relatives (14.8%). A majority of participants lived in nuclear families (66.2%), while 33.8% resided in joint families. Regarding household size, 15.4% had 1–3 members, 69.6% had 4–7 members, and 15.0% had more than 7 members. Maternal education levels showed that 24.4% had no formal education, 27.0% had not completed primary education, 26.2% had completed primary education, 14.6% had not completed secondary education, and 7.8% had completed secondary education. In contrast, paternal education levels were slightly higher: 15.2% had no formal education, 20.4% had not completed primary, 16.0% completed primary, 22.2% had not completed secondary, and 26.2% had completed secondary education. Regarding parental employment status, 47.0% of the participants had housewife mothers, 51.2% had working mothers, and 1.8% had deceased mothers. For fathers, 65.4% were employed, 30.4% were unemployed, and 4.2% were dead.
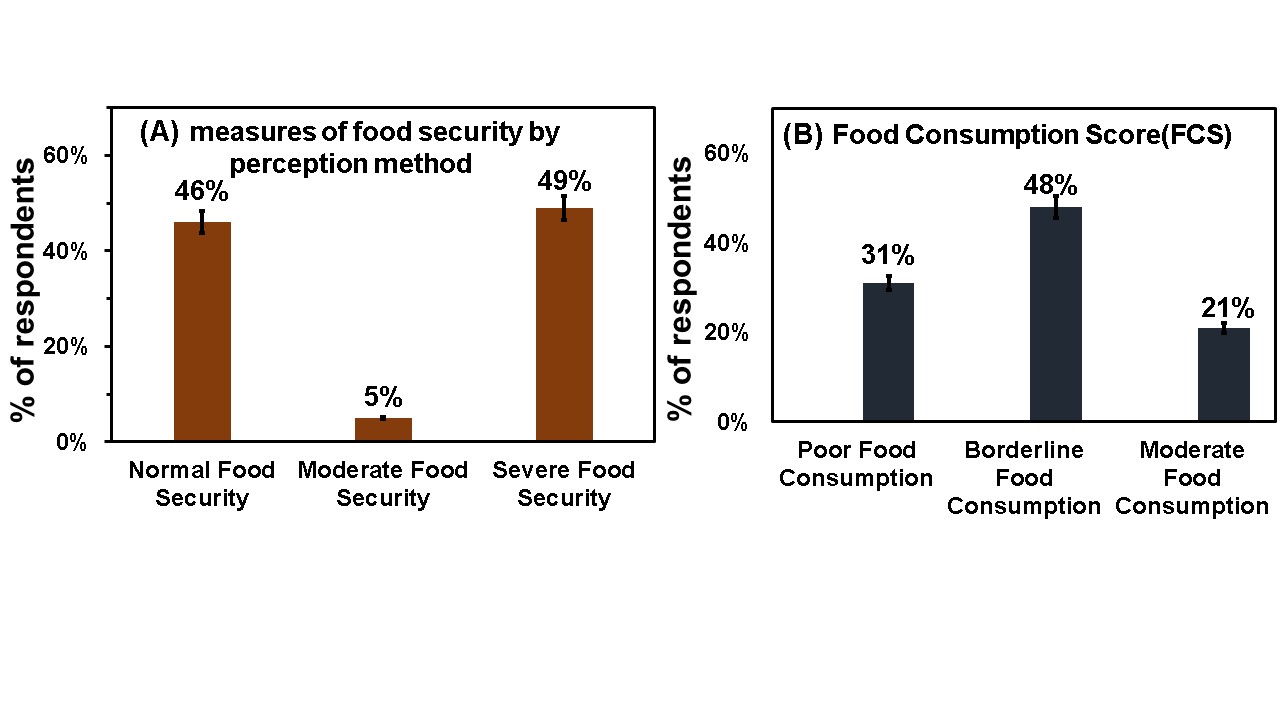
For determined of food security by Perception Method, the participants were asked to answer three inquiries to assess food insecurity in their houses. The scale ranged from normal food insecurity (consumed three meals per day), moderate food insecurity (taking less than three meal a day) to severe level food insecurity (slept with hunger). Figure 1 represent the summary results about food security determined using both the perception method as well as Food Consumption Score (FCS) method. Among the 500 participants, only 46.00% (n=230) have normal level of food insecurity, 5.00% (n=25) people have moderate level of food insecurity and maximum 49.00% (n=245) have severe level of food insecurity.
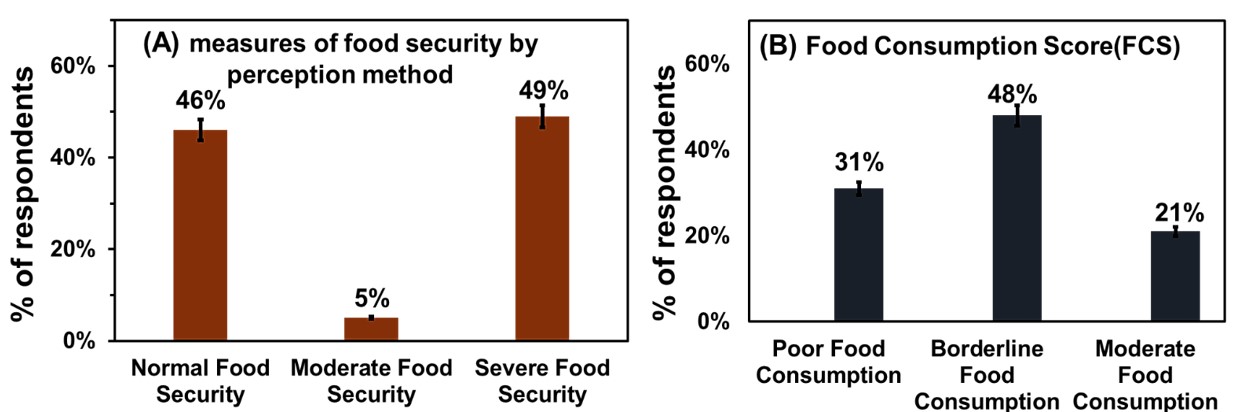
Figure 1. (A) Distribution of food security status based on the perception method, categorized into normal, moderate, and severe food insecurity. (B) Summary of Food Consumption Score (FCS): scores ranging from (0–21) indicate poor food consumption, scores between (21–35) indicate borderline consumption, and scores above 35 reflect acceptable food consumption.
The Food Consumption Score (FCS) is a cumulative measure dependent on nutritional variation, nutritional frequency range, and the comparative nutrient significance of various dietary items. It is applied by institutions like the World Food Program (WFP) to measure dietary stability and nutrition adequacy at the domestic scale. The FCS can be grouped into three levels of food consumption: Poor food consumption, where FCS 0-21; Borderline food consumption, where 21-35; and, Acceptable food consumption, where FCS > 35. As shown in Figure 1, among the total 500 participants, 31.00% (n=158) have poor level food consumption (FCS 0-21), 48.00% (n=237) have borderline level food consumption (21 < FCS ≤ 35) and the rest 21.00% (n=105) have acceptable level food consumption (FCS > 35).
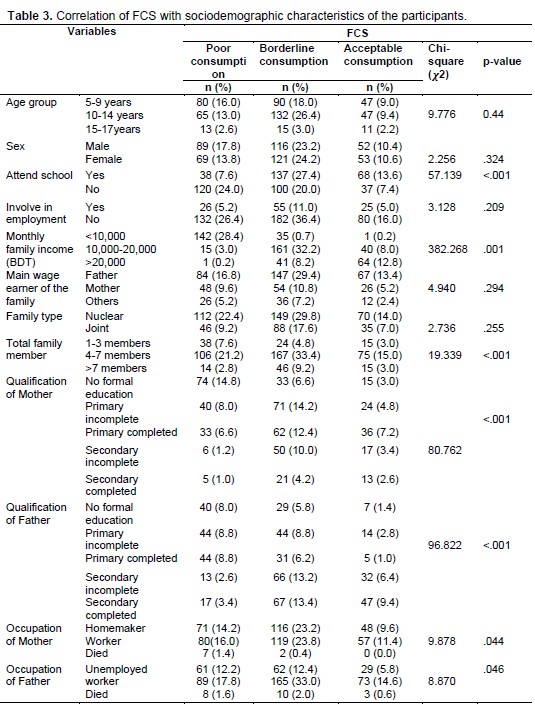
Table 3 illustrates the relationship between Food Consumption Score (FCS) and key sociodemographic factors among the study participants. Statistically significant associations were observed between FCS and education level (p = 0.001), monthly family income (p < 0.001), occupation (p = <0.05), and family size (p = 0.023). Participants with higher educational attainment, greater monthly income, and smaller family sizes tended to have more favorable FCS outcomes. In contrast, age (p = 0.165), sex (p = 0.145), and marital status (p = 0.181) did not demonstrate significant associations with FCS. Educational level was strongly correlated with FCS. Participants with tertiary education exhibited higher FCS compared to those with lower educational attainment. Monthly income showed a significant positive association with FCS. Higher-income participants reported better food consumption scores, reflecting their improved access to diverse and nutritious foods. Family size also correlated significantly (p = 0.023), with smaller families generally having higher FCS. Occupation was another determinant with a significant impact. Those employed in stable and professional jobs tended to have higher FCS, likely due to better income stability and access to food.
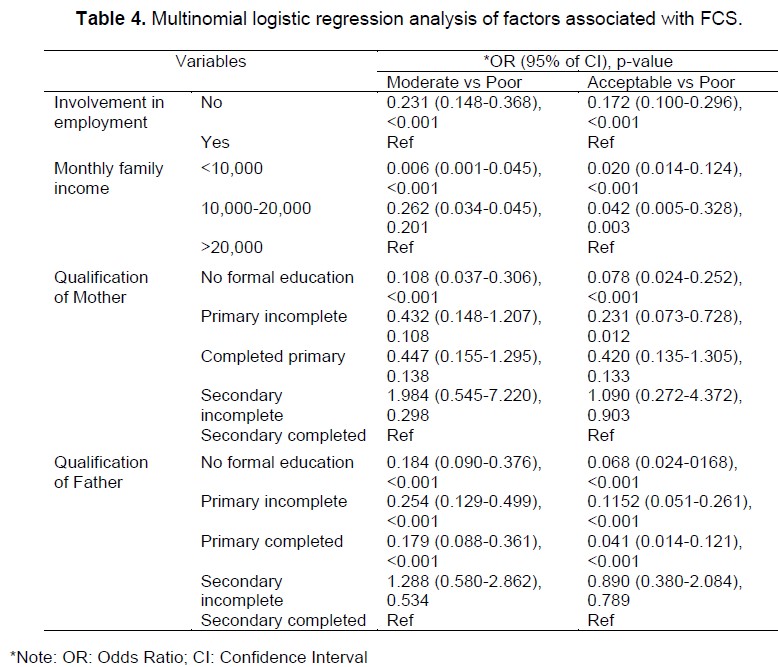
Table 4 presents the results of a multinomial logistic regression examining factors associated with different levels of FCS. Compared to the reference category (poor FCS), employment significantly increased the odds of having moderate (OR = 0.231; 95% CI: 0.148–0.368; p < 0.001) and acceptable FCS (OR = 0.172; 95% CI: 0.100–0.296; p < 0.001). Monthly income under 10,000 BDT was strongly associated with decreased odds of moderate (OR = 0.006; p < 0.001) and acceptable FCS (OR = 0.020; p < 0.001), while income between 10,000–20,000 BDT also showed significant associations with acceptable FCS (OR = 0.042; p = 0.003). Maternal education was significantly associated with FCS; children of mothers with no formal education had notably lower odds of achieving moderate (OR = 0.108; p < 0.001) and acceptable FCS (OR = 0.078; p < 0.001) compared to those whose mothers had completed secondary education. Similarly, paternal education showed a significant protective effect: fathers with no formal education were associated with lower odds of moderate (OR = 0.184; p < 0.001) and acceptable FCS (OR = 0.068; p < 0.001). Children whose fathers had only completed primary education also had reduced odds of achieving acceptable FCS (OR = 0.041; p < 0.001).
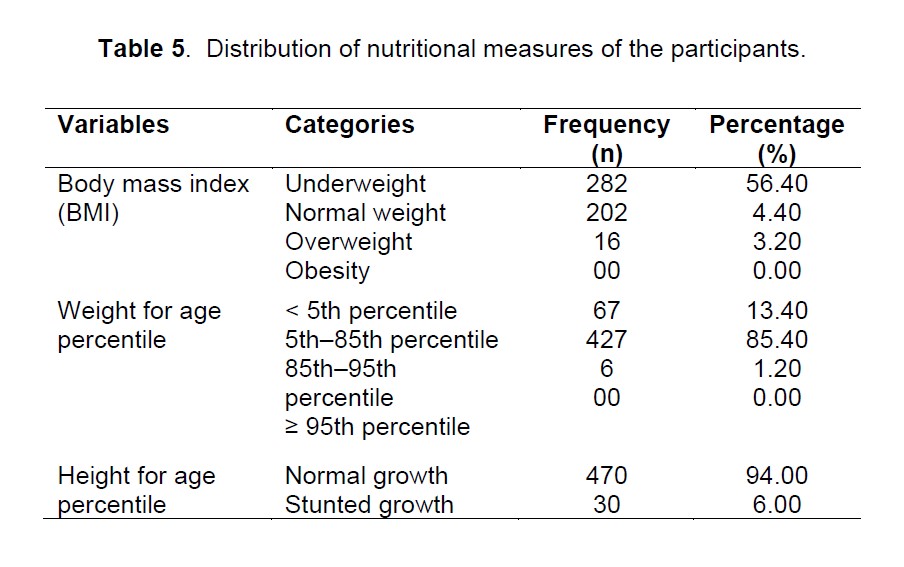
In Table 5, among the 500 study participants, Body Mass Index (BMI) classifications revealed that 56.4% (n = 282) were underweight (BMI < 18.5), 40.4% (n = 202) had normal weight (BMI 18.5–24.9), and 3.2% (n = 16) were overweight (BMI 25.0–29.9). Notably, none of the participants were classified as obese (BMI ≥ 30.0).
Assessment based on BMI-for-age percentiles indicated that 13.4% (n = 67) of participants were underweight (< 5th percentile), 85.4% (n = 427) had normal body weight (5th–85th percentile), and 1.2% (n = 6) were overweight (85th–95th percentile). No participants were categorized as obese (≥ 95th percentile). Height-for-age percentile data showed that 6.0% (n = 30) of participants exhibited stunted growth (< 5th percentile), while the remaining 94.0% (n = 470) demonstrated normal linear growth (> 5th percentile).
As summarized in Table 6, the association between BMI categories and Food Consumption Scores (FCS) showed that a significantly higher proportion of underweight participants had poor FCS (p < 0.001). Among those categorized as underweight, 85.1% had a poor FCS, while only 13.5% and 1.4% had moderate and acceptable FCS, respectively. For participants with normal BMI, 78.7% had poor FCS, whereas 17.3% and 4.0% fell under moderate and acceptable FCS categories, respectively. Overweight participants exhibited comparatively better FCS, with 62.5% having poor FCS, 31.3% moderate, and 6.3% acceptable.
The socio-demographic profile of the study population shows a well-balanced representation, with almost equal gender distribution and diverse age, educational, and employment backgrounds. Most participants come from low- to middle-income families with moderate education and larger household sizes-factors known to influence household food security status [23]. The findings reveal a high prevalence of food insecurity and poor dietary diversity among children and adolescents in Bangladesh’s urban slums. The widespread occurrence of moderate to severe food insecurity, coupled with low Food Consumption Scores (FCS), underscores serious nutritional challenges. These observations align with prior studies highlighting stunting and micronutrient deficiencies among slum-dwelling children [24, 25]. Limited access to nutritious, affordable food, compounded by the absence of formal food distribution systems in slum areas, often forces reliance on calorie-dense but nutrient-poor diets [26, 27].
Statistical analyses presented in Table 3 underscore the significant role of socioeconomic determinants in shaping food security outcomes. Parental education, especially maternal, was positively associated with higher FCS values that education enhances nutritional awareness and informed dietary decisions [28]. Higher monthly income showed a strong positive correlation with dietary diversity, consistent with evidence that income improves food purchasing power and nutritional variety [29]. Occupational stability also emerged as a significant predictor, with participants in more secure jobs showing better dietary scores. Family size, conversely, was inversely associated with FCS, reinforcing findings that larger households face greater food access challenges. Interestingly, no statistically significant associations were found for age, sex, or marital status-factors sometimes reported in food security disparities potentially due to the homogeneity of the study population.
Nutritional assessments revealed a substantial burden of undernutrition, with 56.4% of participants classified as underweight by BMI. These results support national findings of persistent undernutrition in urban poor communities, despite broader improvements in child health indicators [30]. Additionally, 13.4% were underweight and 6.0% stunted based on age-standardized metrics, indicating both acute and chronic malnutrition. Stunting in particular reflects long-term exposure to dietary inadequacy and poor living conditions [22]. The statistically significant relationship between poor nutritional status and inadequate dietary diversity, with underweight children more likely to have low FCS. This supports prior findings that FCS is a valid proxy for food security in vulnerable populations [10, 31]. Notably, a small fraction of participants (3.2%) was overweight, indicating an emerging double burden of malnutrition, a trend documented in many low- and middle-income countries undergoing rapid urbanization [32].
These results highlight the need for comprehensive, long-term strategies to address child food insecurity in urban slums. Beyond food aid, investments in parental education, income-generating opportunities, and consistent school attendance are critical to improving nutritional outcomes and breaking the cycle of poverty and malnutrition in these vulnerable settings.
This study highlights the alarming levels of food insecurity and malnutrition among children and adolescents (ages 5–17) living in urban slums in Bangladesh. More than half of the population studied is underweight, and nearly half experience borderline food consumption levels. Key contributing factors include low parental education, household poverty, and large family sizes, all of which exacerbate nutritional deficiencies. These findings underscore the urgent need for comprehensive, multi-pronged interventions: (1) economic empowerment programs to increase household income of people living in slums, (2) initiatives for health education to enhance nutritional awareness, and (3) school-based strategies to provide consistent access to nutritious food. Addressing these challenges is critical to breaking the intergenerational cycle of poverty and malnutrition, promoting equitable health outcomes, and advancing progress toward the Sustainable Development Goals. Policymakers must prioritize integrated approaches that combine immediate food support with long-term socioeconomic investments to build resilience in vulnerable urban communities.
We extend our heartfelt gratitude to everyone who contributed to the successful completion of this research project. We are especially thankful to the residents of the slums in Dhaka city for their valuable time and willingness to participate in our interviews, making data collection possible. Our sincere thanks also go to our project supervisor and faculty member of the Department, whose guidance and support were instrumental in carrying out this study.
This research was conducted with self-funding. Therefore, any kind of financial support was not received for this study.
The authors declare no conflict of interest. All aspects of this research were conducted impartially and independently.
This study did not involve any experiments on human participants or animals; therefore, formal written informed consent was not required. Verbal informed consent was obtained from all participants prior to data collection. Participation was entirely voluntary, and respondents were assured of the confidentiality and anonymity of their information throughout the study.

This work is licensed under a
Creative Commons Attribution 4.0 International License
.
You are free to share and adapt this material for any purpose, even commercially, as long as you give appropriate credit.
 access