J. Biosci. Public Health. 2026; 2(2)
First and Corresponding Author
![]() https://orcid.org/0000-0002-4909-3020
https://orcid.org/0000-0002-4909-3020
Affiliations:
Department of Environmental Science, Faculty of Environmental Science and Disaster Management, Patuakhali Science and Technology University, Patuakhali-8660, Bangladesh.
Coauthor
![]() https://orcid.org/0009-0001-4255-3661
https://orcid.org/0009-0001-4255-3661
Affiliations:
Department of Emergency Management, Faculty of Environmental Science and Disaster Management, Patuakhali Science and Technology University, Patuakhali-8660, Bangladesh.
Coauthor
![]() https://orcid.org/0009-0000-1546-3858
https://orcid.org/0009-0000-1546-3858
Affiliations:
Department of Environmental Science, Faculty of Environmental Science and Disaster Management, Patuakhali Science and Technology University, Patuakhali-8660, Bangladesh.
Coauthor
![]() https://orcid.org/0000-0002-6373-3223
https://orcid.org/0000-0002-6373-3223
Affiliations:
Department of Environmental Science, Faculty of Environmental Science and Disaster Management, Patuakhali Science and Technology University, Patuakhali-8660, Bangladesh.
Coauthor
![]() https://orcid.org/0009-0007-2037-878X
https://orcid.org/0009-0007-2037-878X
Affiliations:
Department of Geo Information Science and Earth Observation, Faculty of Environmental Science and Disaster Management, Patuakhali Science and Technology University, Patuakhali-8660, Bangladesh.
Noise pollution in the peri-urban region of Bangladesh is a growing environmental concern, having significant adverse effects on human health. In this cross-sectional study, both primary and secondary data were utilized for assessing the level of noise pollution at Patuakhali municipality and assessing the impact on human health. The noise level is measured from 8:00 AM to 8:00 PM at various times. Inverse Distance Weighted (IDW) is also applied to visualize the impacted areas. A semi-structured questionnaire is developed to assess knowledge and perceptions regarding noise exposure and its impacts on health of participants. Results from the analysis indicated that noise levels at the commercial and traffic zones consistently exceeded permissible limits, with the highest level attaining 87.9 dBA in traffic areas. Surprisingly, the silent zones also significantly surpassed permissible limits, particularly during the afternoon and evening. Besides, it is affecting children more than other age groups, as they mentioned that they are frequently having symptoms, such as headaches and sleep disturbance. Conversely, adolescents displayed initial indicators of heart disease. The younger adults exhibited greater vulnerability to long-term consequences, while older adults claimed they were facing high blood pressure and cardiovascular conditions. The self-reported health impacts and noise level have a significant positive correlation (p < 0.001). This study reveals the need for effective noise control strategies and strengthened regulatory bodies to protect public health in rapidly urbanizing municipalities of Bangladesh
Any unpleasant and unwanted sound that exceeds the permissible level and creates irritation is considered noise [1-3]. According to previous studies, noise is an intolerable sound that can cause irritations, mental problems, physiological discomfort, and strain on the auditory system [4, 5]. In addition, the World Health Organization (WHO) claimed noise is the third most detrimental type of pollution in urban areas. In addition, noise can be converted into noise pollution when the level of noise becomes intolerable [6]. Unlike other pollutants, the contaminants of noise pollution are waves, not physical particles, which disrupt identical waves and occur naturally in the environment [7]. The logarithmic decibel (dB) scale is used to determine the level of sounds. The human ear is capable of detecting sounds within a range of 0 to 180 dB [8, 9].
Despite the growing prevalence, noise pollution remains a pervasive yet often discarded environmental concern. The predominant source of noise pollution is the activities of humans, including industrial development, transportation systems, and the use of microphones in urban areas nowadays [10,11]. Multiple studies claimed that noise pollution can lead to hypertension, headaches, irritability, anxiety, and violent crimes [9, 13-15]. Exposure to noise levels of 85 dB for more than eight hours can pose significant health issues [16]. 90% of educational institutions in the Kathmandu Valley are faced with noise pollution that exceeds the national noise level standards, resulting in a lower number of students [17]. Moreover, noise pollution can disrupt social interactions and increase isolation for elderly people [10]. The individual workers of Portugal, Malta, and Turkey claimed that they were exposed to loud noises for at least 25% of their working time [18, 19]. In addition, the 22 million workers of the United States, Finland, Germany, and Iran suffer from heart disease and hearing difficulties due to noise pollution at work [20-24]. Similarly, studies conducted in Sweden and Denmark have reported an increased incidence of stroke associated with road traffic noise [25].
Previous studies conducted in major metropolitan cities of Bangladesh, including Dhaka, Chattogram, and Khulna, have consistently reported ambient noise levels exceeding nationally permissible limits [26, 27]. For example, while the allowable roadside noise limit is 60 dB, measured levels in Chattogram have reached up to 93 dB [12,16]. Similarly, a study conducted in the Barishal City Corporation area reported elevated noise levels ranging from 81.58 to 84.62 dB in sensitive locations, including Sher-E-Bangla Medical College Hospital and a school for visually impaired students, indicating substantial exposure risks in designated silent zones [6]. Prolonged exposure to such elevated noise levels has been associated with a range of adverse health effects, including headaches, hypertension, insomnia, irritability, and reduced overall wellbeing.
Bangladesh has experienced rapid infrastructural expansion in recent years, with major development projects extending beyond large metropolitan centers to smaller and peri-urban municipalities. Patuakhali Municipality is currently undergoing extensive construction activities involving roads, bridges, educational institutions, and commercial facilities, leading to increased environmental noise exposure for local residents. Despite these developments, systematic assessments of ambient noise levels and their associated health impacts have not yet been conducted in this municipality. Therefore, the present study aimed (i) to quantify current noise levels across different functional zones and (ii) to examine the health impacts of noise pollution among different age groups in the study area.
This study is of particular public health significance as it provides empirical evidence from a smaller coastal municipality in Bangladesh. By integrating measured noise levels with national regulatory standards and self-reported health outcomes across age groups, the study identifies vulnerable populations and high-risk urban zones, offering evidence to support local policy enforcement, targeted community-level health interventions, and future research on noise pollution in similar settings.
2.1. Data sources and study design
Both primary and secondary data were utilized to achieve the objectives of this cross-sectional study. Primary data were collected through field-based environmental noise measurements and a structured questionnaire survey directed to local residents. Secondary data were obtained from official government agencies, non-governmental organizations, statistical reports, peer-reviewed journal articles, policy documents, and relevant online databases. Secondary data was used both for the literature review and comparative analysis, especially to compare the measured noise levels with national standards to determine whether the recorded noise levels exceeded acceptable limits. In addition, demographic and land-use information for the study area was collected from the Patuakhali Forest Office and other relevant local government institutions.
2.2. Study area
The study was conducted in the southern coastal region of Bangladesh, specifically in the Patuakhali municipality. About 227.1 kilometers from the capital, Dhaka, it is located between 90°12' and 90°28' east longitudes and between 22°14' and 22°29' north latitudes. Patuakhali municipality serves as the district's administrative and business center in Patuakhali Sadar Upazila. According to the 2022 census, the Pourashava (municipality town) is home to 82,521 people and occupies 13,51 square kilometers with nine wards [28]. Figure 1 presents a geographical depiction of the designated study area.
2.3. Selection of study site and period
Almost every significant traffic intersection may be covered according to the site selection process. The nine main locations (Chowrasta, Launch Ghat, Bus Stand, Kolatala Housing, Patuakhali Medical College Hospital, Jublee School (SDO Road), Sabujbag Square, Latif Municipal School, and New Market) of the five functional zones at Patuakhali municipality, which include residential areas, commercial areas, quiet areas, busy traffic areas, and educational areas were taken into consideration to calculate the amount of noise pollution in the study area during the winter season of February 10–28, 2023.
2.4. Noise measurement equipment and study sites
Ambient noise levels were measured using a calibrated, digital Sound Level Meter (SLM-270) (Figure 2). The instrument measures sound pressure levels in decibels (dB) within a range of 30–130 dB and has a measurement accuracy of ±1.5 dB. The device provides a resolution of 0.1 dB and supports both A-weighted (dBA) and C-weighted (dBC) measurements, allowing for appropriate assessment of environmental noise exposure. The frequency response of the meter ranges from 31.5 Hz to 8.5 kHz, which is suitable for capturing typical urban noise sources.
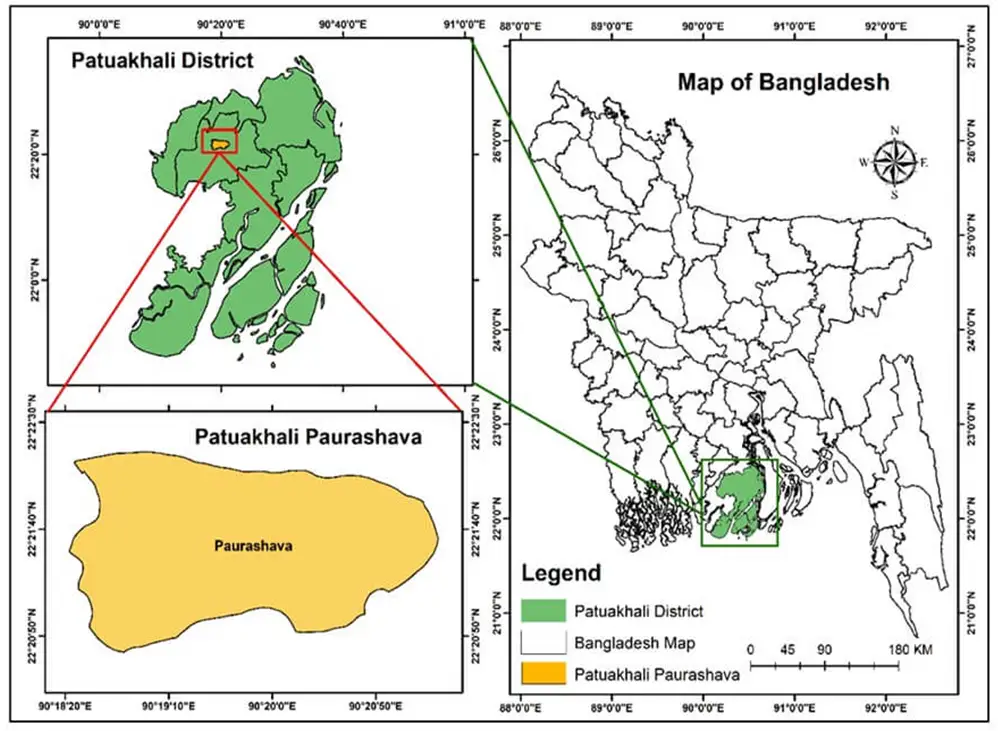
Figure 1. Study area map of the Patuakhali municipality.
The sound level meter offers selectable fast (8 measurements per second) and slow (2 measurements per second) response modes, enabling flexibility in capturing fluctuating and steady noise conditions. A maximum hold function was employed to record peak noise levels during monitoring periods. The instrument includes an integrated condenser microphone that converts sound pressure variations into corresponding electrical signals. An AC analog output jack allows external data recording when required. The device is powered by alkaline batteries, providing up to 20 hours of continuous operation under standard field conditions.
In areas free of wind and rain, nine significant locations in the Patuakhali municipality were chosen at random to measure the noise level between 8 a.m. and 8 p.m. using a meter that was 1.3 to 1.5 m above the ground. Only working days were used for data collection. Readings were obtained frequently after a predetermined amount of time in order to calculate the average sound value of the noise pollution. 30-minute intervals were used to manually record the noise pressure level. The investigation involved measuring A-weighted sound levels. The answer "Human Ear Listening" simulates the "A weighting" attribute. The SLM microphone was at the proper position and distance for each sample site.
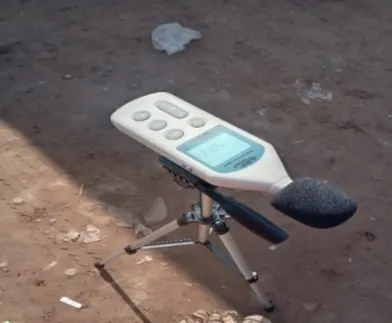
Figure 2. Sound level meter (SLM-270).
2.5. Questionnaire for survey data collection
A semi-structured questionnaire was developed to collect data on sociodemographic characteristics of participants, assess their knowledge and perceptions regarding noise exposure and its impacts on health, using Kobo Toolbox. The questionnaire included both closed and open-ended questions. Example questions included, “Do you know the government's acceptable noise limit? Do you have any suggestions to reduce noise pollution?” The instrument was newly developed for this research and pretested with a small group of respondents to ensure clarity and relevance. A total of 50 respondents, including businessmen, housewives, business owners, drivers, transport staff, day laborers, and hawkers of all ages, were selected at random. While the sample size is relatively small, it reflects practical constraints in accessing all participants in the study area and has been acknowledged as a limitation in the manuscript.
2.6. Data analysis
After collecting data from the questionnaire survey and the Sound Level Meter, the data were analyzed using various statistical methods, including frequency distribution, visualizing graphs, charts with percentage data, and Inverse Distance Weighted (IDW) to visualize the present situation in three maps with different time zones. Then, two statistical tests, including chi-square and Spearman correlation, were performed to examine associations between noise exposure and reported health outcomes. All these analyses were performed using Excel 2016, IBM SPSS 26, and ArcGIS 10.8.2.
3.1. Socio-demographic characteristics of respondents
The socio-demographic profile of the respondents showed a significant background to understand the effects of noise pollution on the health of people in Patuakhali municipality (Table 1). The majority of the respondents were males (74%), because they represent larger numbers of occupations with high noise exposure, including day labor, rickshaw pulling, and traffic management. The age distribution was assessed between 21 and above 80 years, with the most significant representatives in the ages 21-30 years (26%), 51-60 years (24%), and 61-70 years (22%), which means the representatives of the younger and older adults who might be vulnerable to several health-threatening factors. The level of education was low, and 18% of the population was illiterate, and 3% are the ones who have reached beyond secondary school, implying that they were not very aware of the dangers of noise. The patterns of occupation exhibit that 32 percent were day laborers, with other occupations including government staff (20%), teachers (14%), and traffic policemen (4%), indicating variations in the day-to-day contact with sources of noise. These social-demographic features provide important context for understanding differences in noise exposure and self-reported health perception, which provide a background to interpret further observations of measured noise levels and their health effects.
Table 1. Socio-demographic characteristics of respondents.
| Characteristics | Categories | Frequencies | Percentage |
| Gender | Male | 37 | 74% |
| Female | 13 | 26% | |
Age(years) | 21-30 years | 13 | 26% |
| 31-40 years | 5 | 10% | |
| 41-50 years | 2 | 4% | |
| 51-60 years | 12 | 24% | |
| 61-70 years | 11 | 22% | |
| 71-80 years | 7 | 14% | |
Education | Illiterate | 9 | 18% |
| Primary | 13 | 26% | |
| SSC | 5 | 10% | |
| HSC | 10 | 20% | |
| Above HSC | 3 | 3% | |
| Occupation | Day laborer | 16 | 32% |
| Rickshaw puller | 5 | 10% | |
| Teacher | 7 | 14% | |
| Govt. officials | 10 | 20% | |
| Traffic police | 2 | 4% | |
| Others | 10 | 20% |
3.2. Noise levels in different zones of Patuakhali municipality
Table 2 showed that the average noise levels of Patuakhali municipality differed by zone and time. Education zones were found to be above the acceptable 60 dBA limit in the morning (65.3 dBA) and afternoon (66.75 dBA), but evening levels were within acceptability (52.7 dBA). The residential locations generally met the standard of 55 dBA, the only exception being the afternoon (55.3 dBA). Silent zones, which were meant to be served by sensitive institutions, surpassed the 50 dBA limit in the afternoon (51.1 dBA) and evening (55.9 dBA), pointing to noise intrusion. Commercial and traffic zones were the most critical ones where exceedances took place. Business premises were always within 78.95-80.1 dBA, which was much over the 70-dBA limit, and busy roads were screaming so high to the point of 87.9 dBA during the afternoon. Measures in traffic regions were all found to exceed the 75-dBA norm, highlighting serious and chronic exposure conditions.
Table 2. Average noise levels (dBA) across different areas of Patuakhali Municipality.
| Area Code | Category of Area | Morning (08.00-10.00 am) | Afternoon (01.00-03.00 pm) | Evening (07.00-09.00 pm) |
| A | Educational areas | 65.3 | 66.75 | 52.7 |
| B | Residential areas | 48.5 | 55.3 | 44.25 |
| C | Silent areas | 47.9 | 51.1 | 55.9 |
| D | Commercial area | 80.1 | 78.95 | 79.05 |
| E | Busy traffic area | 79.4 | 87.9 | 78.27 |
3.3. IDW of noise levels in different time zones
The generation of noise maps was conducted using the IDW method. Thus, the noise levels were mapped for the following timeframes: morning (8:00–10:00 a.m.), afternoon (1:00–3:00 p.m.), and evening (7:00–9:00 p.m.). The maps in consideration are the outcome of determining the average noise level at each location. During the morning hours (8:00–9:00 a.m.) at nine locations within the designated area, the highest and lowest values were found to be 47.92 dB (A) and 92.7 dB (A), respectively (Figure 3). The results suggested that the high noise levels were prevalent in the Chowrasta, bus station, and the New Market area, which were located within the red circle (85.24 - 92.7 dB(A)). On the other hand, the noise levels were lowest in the regions assigned to housing and medical colleges; a dark green (47.92 - 55.38) dB (A) marker indicated 47.92 - 55.38 dB (A). In contrast, the highest and lowest values obtained during the afternoon (1:00 p.m. - 3:00 p.m.) at nine specific locations within the research area were 51.13 dB(A) and 96.3 dB(A), respectively (Figure 3). According to preliminary results, these numbers were higher than the noise level in the morning. When evaluated during the evening hours, from 7:00 p.m. to 9:00 p.m., at nine distinct locations, the maximum and minimum values recorded were 41.7 dB (A) and 83.6 dB (A), respectively (Figure 3). A comparison of the noise measurements obtained during the evening with those collected in the afternoon reveals significant variations in the values. Furthermore, in addition to the aforementioned, red-marked areas, such as Chowrasta, Bus Stand, and New Market, the Sabujbag area is designated as a high-risk zone during evening hours.
3.4. Compliance with national standards
In comparison with the Bangladesh Noise Pollution Control Rules (2006), the recorded noise levels in the study area showed pervasive disobedience, especially in busy areas (Table 3). The residential districts were partially conforming, with the afternoon level being slightly above the limit of 55 dBA, whereas the morning and evening levels were slightly below the limit. On the contrary, commercial and traffic-prone zones were regularly and significantly higher than allowed limits, achieving up to 15-18 dBA above the norms. More interesting is what happens in educational and silent zones, which are legally considered sensitive zones under the national laws. However, the zones were frequently exceeded even in a protected status, and afternoons and evenings were the most frequently encroached by the urban and traffic noise in the areas, which should still be controlled in terms of sound level. These violations indicate weakness in regulatory enforcement and may increase potential health risks for vulnerable groups, such as students, patients, and the elderly.
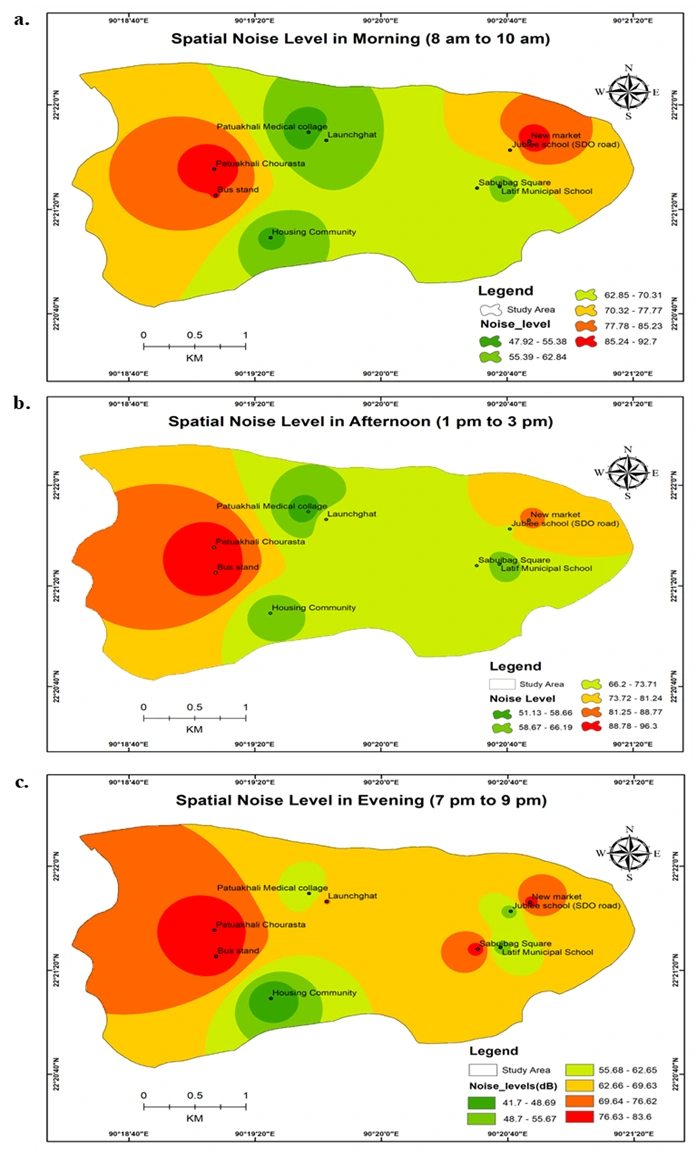
Figure 3. Noise map measured from morning (3a), afternoon (3b) and evening (3c) by the IDW method.
The findings indicate that in the study area, compliance with noise standards primarily occurs in residential zones during low-peak hours, whereas in most other areas, the level of compliance can be identified as systematic and chronic. This reveals significant gaps in governance and a high level of negligence in regulation enforcement, urban planning, and specific interventions and remedies to protect people in the course of vulnerable surrounding health situations.
Table 3. Comparison of noise levels (dBa) with Bangladesh noise pollution control rules, 2006 standards.
| Area Code | Category of Area | Standard Limit (dBA) | Morning (08:00–10:00) | Afternoon (01:00–03:00) | Evening (07:00–09:00) |
| A | Educational Areas | 60 | 65.3* | 66.75* | 52.7 |
| B | Residential Areas | 55 | 48.5 | 55.3* | 44.25 |
| C | Silent areas | 50 | 47.9 | 51.1* | 55.9* |
| D | Commercial Areas | 70 | 80.1* | 78.95* | 79.05* |
| E | Busy traffic Areas | 75 | 79.4* | 87.9* | 78.27* |
Note: Values marked with an asterisk (*) exceed the permissible limits.
3.5. Impact of noise pollution on human health
All reported health outcomes in this section are based on self-reported perceptions of respondents and represent associations rather than clinically verified diagnoses. The survey results exhibited that there were significant age variations in the health effects of noise pollution in the study area (Figure 4). Children represent the most vulnerable group (43%), who complained about noise disturbances. The most frequent complaints were headache (35%) and sleep disturbance (24%), with annoyance (21%) and hearing loss (16%), respectively. These findings indicate that higher noise exposure is associated with self-reported physical health complaints and perceived cognitive difficulties during childhood. Adolescents comprised 23% of reported cases, and headaches (31%) were once again the most common symptom, as were cardiovascular-related symptoms such as heart disease (18%) and hypertension (14%). Dizziness (13%), sleep disorders (10%), and noise-induced hearing loss (9%) also showed a presence, which means that the exposure in the younger years leads to psychological and physiological stress.
Although young adults were the least affected group (7%), they exhibited a greater prevalence of long-term effects. The most prevalent were hearing loss (37%), sleep disorders (31%), depression (21%), and regression of auditory hair cells (11%): these were evidence of both physiological and psychological effects of long-term exposure. The proportion of older adults among reported cases was 30%, and cardiovascular impacts were identified most often. The most frequent ones were hypertension (41%), heart disease (32%), sleep disturbance (18%), and dizziness (7%). These findings suggest an association between reported noise exposure and self-reported cardiovascular-related symptoms among older respondents.
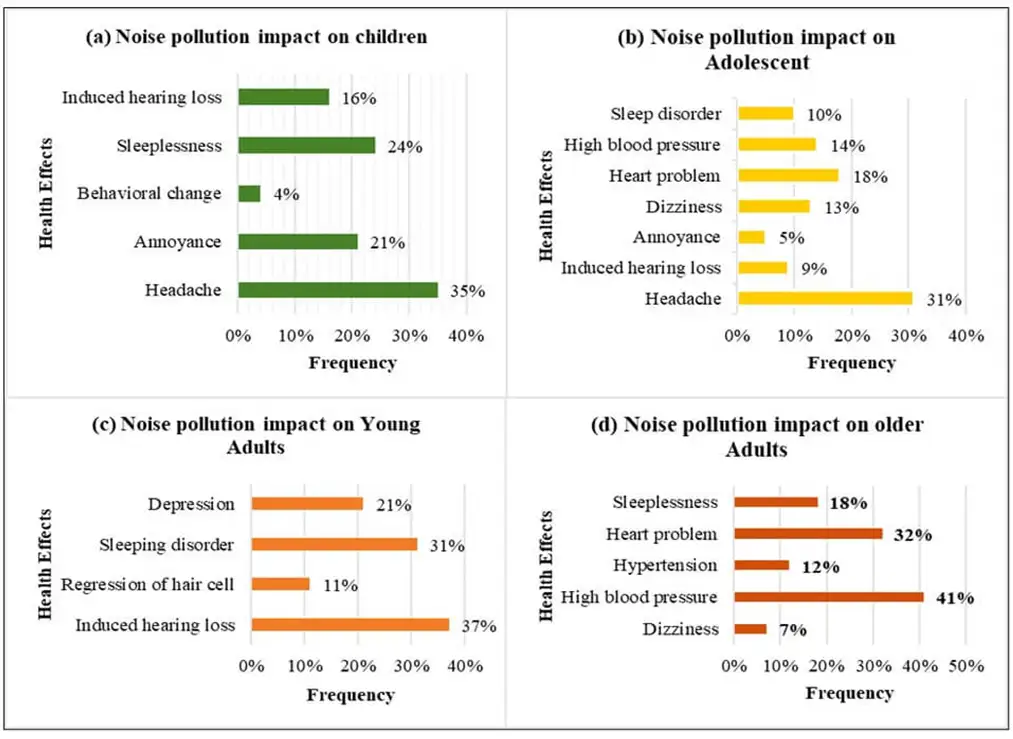
Figure 4. Health impacts of noise pollution across different age groups.
3.6. Chi-Square test
The chi-square test (Table 4) indicated a significant association between the categorical variables, where (χ² (15) = 42.088, Monte Carlo p < .001), corroborated by the likelihood ratio (χ² (15) = 46,45, Monte Carlo p < 0.001). Due to substantial violation of the chi-square assumption (95.8% of expected cell counts < 5: minimum = 0.70), Fisher’s exact test using Monte Carlo estimation (10,000 samples; 99% CI) was applied and remained significant (p = 0.001).
Table 4. Chi-Square test between age groups and health impacts.
| Value | df | Monte Carlo Sig. (2-sided) | |||
| Significance | 99% Confidence Interval | ||||
| Lower Bound | Upper Bound | ||||
| Pearson Chi-Square | 42.088a | 15 | 0.000b | 0.000 | 0.001 |
| Likelihood Ratio | 46.454 | 15 | 0.000b | 0.000 | 0.000 |
| Fisher's Exact Test | 32.374 | 0.001b | 0.000 | 0.001 | |
| N of Valid Cases | 50 | ||||
a. 23 cells (95.8%) have expected count less than 5. The minimum expected count is .70. b. Based on 10000 sampled tables with starting seed 92208573. | |||||
3.7. Spearman correlation between noise level and health impacts
A Spearman correlation was performed to find out the association between noise level and self-reported health impacts (Table 5). The results indicate a strong correlation. In particular, the noise level has a strong positive correlation with headache and sleep disturbance (ρ = 0.937, p < 0.001, and ρ = 0.895, p = 0.001, respectively). In contrast, a moderate positive correlation is observed with annoyance and dizziness. However, hearing loss has no significant association (ρ = .332, p = .091) with noise level in the study area.
Table 5. Spearman correlation between noise level and health impacts.
| Indicator | Health Impacts | |||||
Noise Level | Status | Headache | Annoyance
| Hearing loss | Sleep Disturbance | Dizziness |
| Correlation Coefficient | 0.937* | 0.632 | .332 | 0.895* | 0.554 | |
| Sig. (1-tailed) | 0.000 | 0.006 | 0.091 | 0.001 | 0.040 | |
Correlation is significant at the 0.0 level (1-tailed). *Strongly Significant | ||||||
Noise pollution is a major problem in urban settings. Numerous studies indicate that the present noise level exceeds the prescribed limit in Bangladesh. The present study provides empirical evidence that ambient noise levels in Patuakhali Municipality consistently exceed national regulatory limits across multiple functional zones, with particularly severe exceedances in commercial and traffic-dominated areas. The study highlights the areas with dense population, congested traffic, and commercial activities, including Chowrasta, Launch Ghat, Bus Stand, Kolatala Housing, Patuakhali Medical College Hospital, Jublee School (SDO Road), Sabujbag Square, Latif Municipal School, and New Market of the five functional zones at Patuakhali municipality.
The measured noise levels across educational, silent, commercial, and traffic zones noticeably exceeded the permissible limits of the Bangladesh Noise Pollution Control Rules (2006), particularly during peak afternoon hours. Commercial and traffic zones were the noisiest, with recorded values up to 87.9 dBA, indicating chronic exposure to be harmful to human health. These findings are consistent with previous studies conducted in Dhaka, Chattogram, Rajshahi, Khulna, and Barishal, which identified vehicular traffic, commercial activity, and unregulated horn use as dominant noise sources in urban Bangladesh [5,6,12,16, 26-29]. The spatial clustering of high-noise zones around transport hubs and marketplaces observed in the IDW maps further supports the role of traffic density and land-use intensity as key determinants of urban noise exposure. Specific concern is the consistent exceedance of noise limits in educational and silent zones, which are legally designated as protected areas. Noise levels exceeding 65 dBA in school environments, as observed in this study, have been shown to impair concentration, learning outcomes, and cognitive development among children [17,30,31]. Similar findings from Barishal City Corporation and Kathmandu Valley indicate that institutional zones in South Asian cities are frequently exposed to noise levels comparable to commercial areas, reflecting systemic failures in urban zoning and enforcement [6,17]. The intrusion of traffic and commercial noise into sensitive zones highlights structural weaknesses in municipal planning and underscores the need for buffer zoning and targeted noise mitigation strategies.
The self-reported health outcomes observed across age groups further reinforce the public health relevance of environmental noise exposure. Several studies reported that along with long-time screening, difference of vitamin D, high frequency noise exposure linking to headaches, sleep disturbances, neurocognitive stress, as well as behavioral disturbances during early development [30-32]. Adolescents reported both neurological symptoms and early cardiovascular complaints, suggesting the onset of stress-mediated physiological responses, as documented in previous studies from Bangladesh and elsewhere [12,16,31]. Among older adults, the predominance of hypertension and cardiovascular symptoms aligns with a substantial body of epidemiological evidence linking long-term environmental and occupational noise exposure to elevated risks of ischemic heart disease, stroke, and hypertension [19,20,25,31,32].
The strong positive correlations between measured noise levels and self-reported headache and sleep disturbance further support a dose response relationship between environmental noise exposure and acute health complaints. Similar associations have been reported in urban studies across South Asia and Europe, where noise levels between 40 and 80 dB have been linked to psychosocial stress, sleep disruption, and cardiovascular dysregulation [25, 32]. In contrast, the lack of a statistically significant association between noise level and hearing loss in the present study may reflect the noise-induced auditory damage [9, 21]. The higher prevalence of hearing-related complaints among young adults suggests possible long-term cumulative exposure, a trend previously reported in urban Bangladesh and industrial settings [9, 20]. Furthermore, socio-demographic patterns also influenced vulnerability, such as lower educational attainment and occupation-related exposure (e.g., day laborers, traffic police), which increased health risks, reinforcing findings on socioeconomic disparities in environmental noise impacts [33].
The findings provide empirical evidence of widespread noise exposure and its association with self-reported health concerns in Patuakhali municipality. These results demonstrate the necessity to enforce the regulations more strictly, conduct more effective traffic control, and create awareness. The implementation of the policies, infrastructural measures (e.g., noise suppressors, zoning, control of vehicles), and community education plays a key role in exposure minimization and the safeguarding of the vulnerable population.
This study has several limitations. Its cross-sectional design prevents causal interference, and the small, non-random sample may limit how broadly the findings apply. Health outcomes were self-reported, which could introduce bias. Environmental factors and personal habits that affect health were not fully accounted for. Despite these limitations, the study provides useful insights into how noise exposure can affect public health and highlight priorities for future research in this area.
The self-reported results of this study indicate that the level of noise exposure in Patuakhali Municipality is high than the allowable limits. The noise level at the commercial area was 80.1, 78.95, and 79.05. Unfortunately, it was also higher in educational and silent zones. The IDW results also indicate that the traffic-congested areas like the new market, bus stand, schools, and the Chowrasta are facing noise pollution at a peak. The results of this investigation raise serious concerns regarding the efficacy of environmental legislation and its potential implications for public health. According to the health survey, there were significant age-based differences in self-reported health problems among the respondents. For example, older individuals more frequently reported cardiac symptoms such as high blood pressure and heart disease, while children and teenagers more often reported headaches, sleep issues, and difficulty concentrating. Young individuals reported a higher prevalence of hearing-related complaints, suggesting possible cumulative auditory stress associated with prolonged noise exposure. The study's findings suggest that the observed outcomes, including reduced productivity and perceived well-being, may reflect both direct physiological stress responses and social influence associated with noise exposure. The government and NGOs should take strong action immediately on urban planning to solve these problems. More adherence to noise regulations and improved city planning and infrastructure, such as traffic rerouting and noise barricades, should be the top priorities for policy changes. Programs for education that target susceptible groups with the goal of lowering exposure and promoting protective behaviors may also help to mitigate exposure.
The authors are grateful for the partial funding of the Research and Training Centre (RTC), PSTU, for their financial support. Also, we are very grateful to the community people who have voluntarily participated in the survey and helped a lot by providing information.
This research was supported by the research grants from the Research and Training Center (RTC) of Patuakhali Science and Technology University (PSTU) in the academic year 2021-22.
No potential competing interest was reported by the author(s).
This study was conducted in accordance with established ethical standards for human-subject research. Before data collection, the research protocol, including the survey instrument and consent procedures, was reviewed and approved. All participants were informed about the purpose of the study, the voluntary nature of their participation, and their right to withdraw at any time without any consequences. Informed consent was obtained from each respondent before administering the survey. No personally identifiable information was collected, and all data were kept confidential and used solely for academic and research purposes.
Md. Tariqul Islam: Conceptualization, Questionnaire formulation, Data Analysis, Writing; Israt Zahan Oyshi: Draft Writing, Analysis, Data collection; Md. Parvez: Draft Writing, Analysis, Data collection; Samsun Nahar Shanta: Data Collection, Questionnaire formulation, Mawya Siddeqa: Conceptualization, Data analysis (GIS part), Editing.
Data will be available on request.

This work is licensed under a
Creative Commons Attribution 4.0 International License
.
You are free to share and adapt this material for any purpose, even commercially, as long as you give appropriate credit.
 access