J. Biosci. Public Health. 2026; 2(4)

First Author
arielmaximillianpitoyo@mail.ugm.ac.id
https://orcid.org/0009-0003-1125-804X
Affiliations:
Department of Fisheries Faculty of Agriculture, Universitas Gadjah Mada, Bulaksumur, Yogyakarta-55281, Indonesia
Corresponding Author *
https://orcid.org/0000-0003-3327-9848
Affiliations:
Department of Fisheries Faculty of Agriculture, Universitas Gadjah Mada, Bulaksumur, Yogyakarta-55281, Indonesia
Corresponding Author *
https://orcid.org/0000-0003-3327-9848
Affiliations:
Department of Fisheries Faculty of Agriculture, Universitas Gadjah Mada, Bulaksumur, Yogyakarta-55281, Indonesia
Sargassum hystrix is a brown macroalga containing compounds with potential antioxidant activity. This study evaluated the effect of nominal ultrasound amplitude on extraction yield, Folin–Ciocalteu reducing capacity reported as total phenolic content-equivalents (TPC-equivalents), total flavonoid content (TFC), and antioxidant responses of S. hystrix extracts. A completely randomized design compared ultrasound-assisted extraction (UAE) at 50%, 60%, 70%, 80%, and 90% amplitude with 24-h maceration as a reference treatment. The solvent concentration, solid-to-liquid ratio, extraction time, pulse cycle, particle size, and other operating conditions were fixed. The 70% treatment gave the highest reported TPC-equivalents (76.79 ± 0.97 mg GAE/g), TFC (115.38 ± 1.09 mg QE/g), and FRAP response (81.15 ± 0.69 µmol Fe²⁺/g), and the lowest DPPH IC₅₀ (502.30 ± 6.89 ppm) among the tested settings. Maceration produced the highest gravimetric yield (1.85 ± 0.09%), whereas the 70% treatment produced 1.70 ± 0.22%. Exploratory quadratic fits to the five UAE treatment means showed curved amplitude-response patterns, but inferential regression requires the replicate-level dataset. GC–MS tentatively assigned 47 compounds in the 70% extract, with major relative peak areas for n-hexadecanoic acid (13.94%), oleic acid (13.17%), and cis-7-hexadecenoic acid (10.28%). The lower responses observed at 80–90% amplitude is reported as an association; compound degradation, heating, oxidation, and other mechanisms were not directly measured. Thus, 70% was the most effective amplitude among the tested settings under the selected extraction conditions, not a globally optimized UAE condition.
Indonesia has extensive seaweed biodiversity, including the brown macroalga Sargassum hystrix. Brown macroalgae contain chemically diverse constituents, including phenolic compounds, phlorotannins, sulfated polysaccharides, pigments, and lipophilic metabolites, that may contribute to antioxidant responses in chemical assays [1-3]. Antioxidants can donate electrons or hydrogen atoms to reactive species, whereas excessive reactive oxygen species can oxidize lipids, proteins, and nucleic acids [4, 5]. Antioxidant assays are useful for screening extracts, but their responses depend on assay chemistry and should not be interpreted as direct evidence of in vivo efficacy.
The extraction process affects both total extract mass and the composition of recovered constituents. Maceration is simple but requires prolonged solvent contact. Ultrasound-assisted extraction (UAE) can shorten processing time because acoustic cavitation promotes liquid penetration, particle disruption, and mass transfer [6, 7]. The response depends on frequency, amplitude or acoustic power, duty cycle, treatment time, temperature, solvent composition, solid-to-liquid ratio, particle size, and matrix composition [2, 3, 7]. A nominal percentage amplitude is an instrument setting and should not be treated as a transferable measure of acoustic energy without calibration. Conventional Sargassum extraction studies also illustrate that processing conditions can change extract composition [8, 9].
Prior studies show that the response to UAE can be non-linear. In the brown macroalga Ascophyllum nodosum, medium amplitude produced the highest phenolic and antioxidant responses under a specified protocol, while the relative performance of UAE, microwave-assisted extraction, and combined treatment depended on the target compound class and operating conditions [3]. Studies in other matrices likewise show that solvent polarity, temperature, treatment time, power, particle size, and matrix structure affect the apparent best-performing condition [10–12]. The extraction method also affects the characteristics and antioxidant activity of fucoidan from S. hystrix [1]. However, a controlled comparison of nominal amplitude levels in S. hystrix using the same hydroethanolic protocol and a combined set of response indicators remains limited.
This study asked whether nominal amplitude produces a non-linear response in extraction yield, TPC-equivalents, TFC, FRAP, and DPPH IC₅₀ in S. hystrix under fixed extraction conditions. We hypothesized that an intermediate amplitude would provide higher assay responses than the lowest and highest tested amplitudes. The objective was to identify the most effective amplitude among the tested settings, not to optimize all UAE variables simultaneously. The 70% extract was selected for GC–MS profiling because it had the highest reported TPC-equivalents, TFC, and FRAP response and the lowest reported DPPH IC₅₀.
2.1. Sample Preparation
Sargassum hystrix was collected from Teluk Awur Beach, Jepara, Indonesia. The samples were washed with running water to remove visible impurities and salts, air-dried for one day, and then oven-dried at 40°C until moisture content was below 10%. The dried material was ground and passed through a 40-mesh sieve to obtain particles smaller than approximately 425 µm.
2.2. Ultrasound-Assisted Extraction (UAE)
The sample powder was mixed with 70% ethanol at a solid-to-liquid ratio of 1:4 (w/v). UAE was performed using a Qsonica Q700 sonicator fitted with a 12-mm probe. The nominal operating frequency was 20 kHz, with reported fluctuation between 18 and 20 kHz. Each extraction condition used 200 mL sample volume in a 250-mL vessel with a 78-mm diameter. Three independent extraction replicates were prepared for each condition, and each extract was measured in three analytical replicates. The nominal treatment time was 15 min with a pulsed cycle of 1 min on and 30 s off. Nominal amplitude settings were 50, 60, 70, 80, and 90%. The mixture was centrifuged at 4000 rpm for 10 min, filtered through Whatman No. 42 paper, concentrated at 40°C using a rotary evaporator, and freeze-dried for 24 h. Maceration for 24 h at room temperature with 70% ethanol was used as the reference treatment [13].
2.3. Folin–Ciocalteu Reducing Capacity Reported as TPC-equivalents
TPC-equivalents was determined using the Folin-Ciocalteu method [12]. Briefly, 100 µL of the sample (1 mg/mL) was mixed with 0.75 mL of diluted Folin-Ciocalteu reagent. After 5 minutes of incubation at room temperature, 750 µL of Na₂CO₃ was added. The mixture was incubated for 90 minutes, and the absorbance was measured at 725 nm using a UV-Vis spectrophotometer. TPC-equivalents was expressed as milligrams of gallic acid equivalents per gram of extract (mg GAE/g). Because the Folin–Ciocalteu reagent responds to reducing substances and is not specific to phenolic molecules, the results are reported as TPC-equivalents rather than as an absolute measurement of all phenolics.
2.4. Determination of Total Flavonoid Content (TFC)
TFC was determined using the aluminum chloride colorimetric method [12]. A 100 µL sample was mixed with 4 mL of distilled water and 300 µL of 5% NaNO₂. After 5 min, 300 µL of 10% AlCl₃ was added. After 6 min, 2 mL of 1 M NaOH was added, followed by 3.3 mL of distilled water. The absorbance was measured at 510 nm. TFC was expressed as milligrams of quercetin equivalents per gram of extract (mg QE/g).
2.5. Antioxidant Activity Assays
The Ferric Reducing Antioxidant Power (FRAP) assay was performed by mixing 100 µL of the sample with 900 µL of distilled water and 2000 µL of fresh FRAP reagent. The mixture was incubated at 37°C for 30 minutes, and the absorbance was measured at 593 nm [14]. Results were expressed as µmol Fe²⁺/g extract.
The DPPH radical scavenging assay was conducted by mixing 1 mL of the sample with 1 mL of 0.1 mM DPPH solution. The mixture was incubated in the dark for 30 min, and the absorbance was measured at 515 nm [15]. The antioxidant activity was expressed as the IC₅₀ value in ppm.
2.6. GC-MS Analysis
The extract from the 70% nominal-amplitude treatment was profiled by Gas Chromatography-Mass Spectrometry (GC–MS). Helium was used as the carrier gas at 1 mL/min, and the oven temperature was programmed from 80 to 290°C. Peaks were tentatively assigned by comparison with Wiley and NIST spectral libraries using a similarity index of at least 90%. Relative peak areas are semi-quantitative and are not absolute concentrations. Library matches were not confirmed with authentic standards, and no compound-specific antioxidant activity was measured.
2.7. Statistical Analysis
Data were analyzed using SPSS software. For each treatment, three independent extractions were used as the experimental replicates. Each extract was measured in three analytical replicates; the three analytical readings should be averaged within each extract before inferential testing so that the independent extraction, rather than the analytical repeat, is the experimental unit. The primary comparison comprised six treatment groups: maceration and UAE at 50, 60, 70, 80, and 90% nominal amplitude. The reported group comparison used one-way ANOVA followed by Tukey’s honestly significant difference test at α = 0.05. For the quantitative amplitude analysis, maceration was excluded because it is a different extraction method rather than an amplitude level. A quadratic model with nominal amplitude as a continuous predictor was fitted only descriptively to the five UAE treatment means for each response. The resulting equations and R² values describe treatment-mean trends and are not inferential dose–response results; replicate-level coefficients, confidence intervals, P-values, and lack-of-fit tests require the raw observations. Pearson or Spearman correlations among TPC-equivalents, TFC, FRAP, and DPPH IC₅₀ were likewise calculated only among the five UAE treatment means and are reported as exploratory associations, not replicate-level inferential correlations.
3.1. Extraction Yield and Bioactive Compound Content
The treatment means and Tukey group letters are shown in Table 1. Maceration produced the highest gravimetric yield (1.85 ± 0.09%), although its yield was not significantly different from the 50% and 70% UAE treatments according to the reported Tukey letters. Yield was lowest at 90% amplitude (1.03 ± 0.13%). The 70% treatment produced the highest TPC-equivalents (76.79 ± 0.97 mg GAE/g) and TFC (115.38 ± 1.09 mg QE/g). Relative to maceration, these values were approximately 2.9-fold and 5.9-fold higher, respectively. The TPC-equivalent and TFC responses declined at 80% and 90% relative to 70%, with Tukey group differences reported in Table 1.
Table 1. Effect of nominal ultrasound amplitude on extraction yield and colorimetric indicators.
| Treatment | Extraction yield (%) | TPC-equivalents (mg GAE/g) | TFC (mg QE/g) |
|---|---|---|---|
| Maceration | 1.85 ± 0.09c | 26.61 ± 0.81ᵃ | 19.43 ± 1.43ᵃ |
| 50% | 1.74 ± 0.17c | 26.00 ± 0.81ᵃ | 67.29 ± 0.71ᶜ |
| 60% | 1.66 ± 0.13bc | 46.33 ± 0.81ᵇᶜ | 67.05 ± 1.49ᶜ |
| 70% | 1.70 ± 0.22c | 76.79 ± 0.97ᵈ | 115.38 ± 1.09ᵉ |
| 80% | 1.27 ± 0.05ab | 47.80 ± 0.65ᶜ | 85.62 ± 2.18ᵈ |
| 90% | 1.03 ± 0.13a | 45.18 ± 0.48ᵇ | 59.67 ± 1.80ᵇ |
Note. Values are reported as mean ± SD (n=3). Different superscript letters indicate significant differences at P < 0.05 according to Tukey’s test. TPC = Folin–Ciocalteu reducing capacity expressed as gallic acid equivalents; TFC = total flavonoid content expressed as quercetin equivalents.
3.2. Antioxidant Activity
The antioxidant activity of the extracts, evaluated through FRAP and DPPH assays, is presented in Table 2. FRAP increased from 39.64 ± 1.20 µmol Fe²⁺/g at 50% amplitude to 81.15 ± 0.69 µmol Fe²⁺/g at 70%, then declined at 80% and 90%. DPPH IC₅₀ showed the inverse pattern expected for antioxidant capacity: the lowest value was observed at 70% (502.30 ± 6.89 ppm), while the highest value was observed for maceration (1006.37 ± 37.72 ppm). The reported Tukey letters indicate significant differences among several treatments (Table 2).
Table 2. Antioxidant responses of S. hystrix extracts.
| Treatment | FRAP (µmol Fe²⁺/g) | DPPH IC₅₀ (ppm) |
|---|---|---|
| Maceration | 32.62 ± 0.88ᵃ | 1006.37 ± 37.72ᵈ |
| 50% | 39.64 ± 1.20ᵇ | 888.45 ± 56.69ᶜ |
| 60% | 65.70 ± 0.69ᵈ | 682.50 ± 5.57ᵇ |
| 70% | 81.15 ± 0.69ᵉ | 502.30 ± 6.89ᵃ |
| 80% | 46.15 ± 1.84ᶜ | 820.48 ± 47.56ᶜ |
| 90% | 48.42 ± 1.14ᶜ | 867.36 ± 23.86ᶜ |
Note. Values are reported as mean ± SD. Different superscript letters indicate significant differences at P < 0.05 according to Tukey’s test. FRAP = ferric reducing antioxidant power; DPPH = 2,2-diphenyl-1-picrylhydrazyl; IC₅₀ = concentration providing 50% inhibition.
3.3. Exploratory Amplitude-Response Analysis
Figure 1 presents the reported means and dispersion values. The maceration result is shown at 45% only as a visual reference and was not included in the UAE regression. Quadratic fits to the five UAE treatment means were descriptive and are not substitutes for inferential regression using independent replicates. The fitted equations, with A representing nominal amplitude in percent, are shown in Table 3.
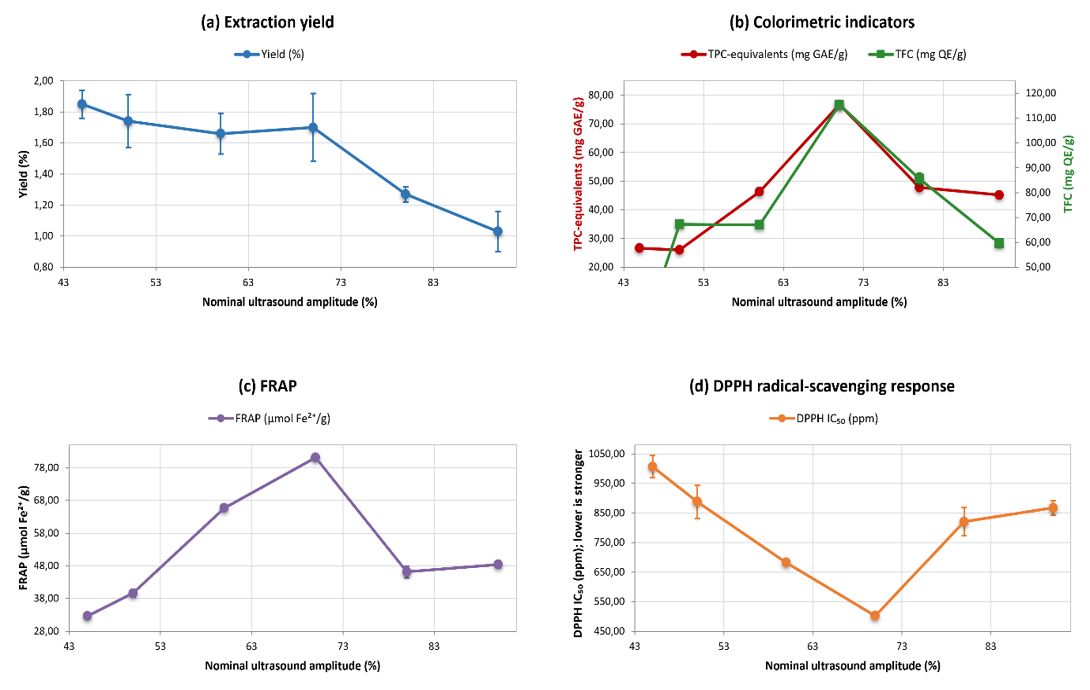
Figure 1. Effect of nominal ultrasound amplitude on extraction yield, TPC-equivalents, TFC, FRAP, and DPPH IC₅₀ of Sargassum hystrix extracts (mean ± SD, n = 3). Maceration (plotted at 45%) is a visual reference only and was excluded from the descriptive quadratic fits (Table 3).
At the treatment-mean level, the assay responses were strongly associated with one another across the five UAE amplitudes: TPC-equivalents versus TFC, r = 0.843; TPC-equivalents versus FRAP, r = 0.885; TPC-equivalents versus DPPH IC₅₀, r = -0.889; TFC versus FRAP, r = 0.704; TFC versus DPPH IC₅₀, r = -0.803; and FRAP versus DPPH IC₅₀, r = -0.983. These are exploratory correlations among five treatment means and must not be interpreted as replicate-level inferential correlations. The final analysis should recompute the relationships from independent observations.
Table 3. Descriptive quadratic models fitted to the five UAE treatment means. Models take the form y = β₀ + β₁(A − 70) + β₂(A − 70)², where A is nominal ultrasound amplitude (%). R² values describe the fit to the five treatment means only and do not represent inferential dose–response analysis.
| Response | Quadratic model  and and |
|---|---|
| Extraction yield (%) | ; |
TPC-equivalents (mg GAE/g) | ;  |
| TFC (mg QE/g) | ; |
| FRAP (µmol Fe²⁺/g) | ; |
| DPPH IC₅₀ (ppm) | ; |
Note. The R² values describe the five plotted means only. P-values, confidence intervals, and lack-of-fit tests require replicate-level observations and are not reported here.
3.4. Tentative GC–MS Assignments
GC–MS profiling of the 70% extract tentatively assigned 47 compounds (Table 4). The largest reported relative peak areas were n-hexadecanoic acid (13.94%), oleic acid (13.17%), cis-7-hexadecenoic acid (10.28%), hexadecanoic acid methyl ester (5.13%), 9-octadecenoic acid methyl ester (3.36%), and 9,12-octadecadienoic acid (2.90%). Phytol and α-tocopherol accounted for 0.80% and 0.47%, respectively. These assignments describe compounds detected under the GC–MS conditions; they do not establish absolute concentration, antioxidant activity in the unfractionated extract, or causal contribution to FRAP or DPPH responses.
Table 4. Major tentative GC–MS assignments in the 70% extract.
| No. | Compound name | Area (%) |
|---|---|---|
| 1 | n-Hexadecanoic acid (Palmitic acid) | 13.94 |
| 2 | Oleic acid | 13.17 |
| 3 | cis-7-Hexadecenoic acid | 10.28 |
| 4 | Hexadecanoic acid, methyl ester | 5.13 |
| 5 | 9-Octadecenoic acid (Z)-, methyl ester | 3.36 |
| 6 | 9,12-Octadecadienoic acid (Z,Z)- | 2.90 |
| 7 | Phytol | 0.80 |
| 8 | Vitamin E (α-Tocopherol) | 0.47 |
Note. Relative areas are semi-quantitative library-based peak areas.
The major finding of this study is a non-linear association between nominal amplitude and the measured responses under one fixed extraction protocol. The 70% treatment had the highest reported TPC-equivalents, TFC, and FRAP response and the lowest DPPH IC₅₀ among the tested UAE settings. This supports its designation as the most effective amplitude among the tested settings. It does not establish an overall optimum because solvent concentration, solid-to-liquid ratio, treatment time, pulse cycle, particle size, temperature, frequency, probe geometry, and calibrated acoustic power were not jointly optimized.
Acoustic cavitation can increase liquid movement, tissue disruption, surface area, and mass transfer [6,7]. The present pattern is consistent with this general mechanism, but the amplitude percentage alone does not quantify the energy delivered to the sample. Garcia-Vaquero et al. reported that medium amplitude gave the strongest phenolic and antioxidant responses in A. nodosum under their specific extraction protocol, while different technologies fevered different compound classes [3]. The comparison is qualitative because the species, solvent, time, temperature, amplitude scale, and response units differ. Work on Sargassum and other plant matrices likewise shows that particle size, solvent composition, temperature, and processing time can shift the apparent best-performing condition [11,12,16].
Gravimetric yield and assay-based indicators responded differently to extraction method. Prolonged maceration recovered a larger total mass of soluble, whereas the ultrasound treatments generated extracts richer in Folin–Ciocalteu- and aluminum-chloride-reactive constituents and in compounds that reduce Fe³⁺ or quench DPPH. This divergence is expected: yield quantifies all dried extractables, while the colorimetric assays report selective chemical reactivity. Extended solvent contact can therefore extract non-target matrix components (polysaccharides, inorganic salts, low-reactivity lipids) that dilute the concentration of assay-responsive molecules [13,17]. Ultrasound appears to produce a smaller but chemically enriched fraction under the conditions employed [4]. Direct compositional mass-balance or fractionation data would be required to confirm this interpretation. The decrease in assay responses at 80% and 90% amplitude should not be described as proven degradation. Higher nominal amplitudes can alter shear, mixing, local pressure, and temperature, and ultrasound-mediated chemical reactions depend on the solvent and operating conditions [10, 17]. However, this study did not measure the temperature trajectory, dissolved oxygen, oxidation products, degradation kinetics, or concentration changes of individual compounds across amplitude levels. Alternative explanations include a change in extraction selectivity, matrix interactions, analytical interference, or loss of assay-responsive constituents. Direct temperature monitoring and targeted chromatographic comparison would be needed to distinguish these mechanisms.
Both colorimetric assays used here are operational rather than compound specific. The Folin–Ciocalteu reagent responds to any reducing species; non-phenolic reductants (ascorbate, amino acids, reducing sugars, certain lipids) that are abundant in algal matrices can contribute to the measured signal [18,19]. Recent critical reviews conclude that, in the majority of phycological studies, the assay functions more as a measure of reducing capacity than as a true total-phenolic inventory [18]. The aluminum-chloride method for flavonoids is likewise sensitive to the choice of reference standard and to matrix effects [19]. The reported values are consequently useful comparative indicators under identical assay conditions, but they should not be regarded as exhaustive quantitative inventories of the phenolic or flavonoid complement of S. hystrix.
GC–MS profiling of the most active extract provided tentative library assignments for 47 compounds. Relative peak areas are semi-quantitative and do not represent absolute concentrations; authentic standards would be required for definitive identification [19]. Although several major constituents (n-hexadecanoic acid, oleic acid, phytol, α-tocopherol) have documented antioxidant activity in isolation [20–23], their presence in the unfractionated extract does not establish causal responsibility for the observed FRAP or DPPH responses, nor does it demonstrate synergistic interactions. Activity-guided fractionation, pure-compound assays and mixture-reconstruction experiments remain necessary to link individual metabolites to the measured antioxidant capacity [21,23].
This study has several limitations. Only nominal amplitude was varied; other extraction parameters (solvent, time, particle size, temperature control) were kept constant. Acoustic energy was not measured by calorimetry, so the amplitude percentages cannot be directly compared with other equipment. Temperature and oxygen levels during sonication were not monitored, so we cannot confirm whether the drop-in activity at high amplitudes was caused by degradation. The Folin–Ciocalteu and aluminum-chloride assays measure overall reducing capacity rather than specific phenolics, and the GC–MS identifications are only library-based and remain unconfirmed by authentic standards.
Future studies should measure actual acoustic power, track temperature during extraction, test multiple variables together, and combine colorimetric assays with targeted LC–MS analysis. Isolating individual compounds and testing them alone would also help clarify which metabolites drive the antioxidant activity.
Under the selected extraction conditions, nominal ultrasound amplitude was associated with differences in extraction yield, TPC-equivalents, TFC, FRAP, and DPPH IC₅₀ in S. hystrix extracts. The 70% setting was the most effective amplitude among the tested settings for the reported colorimetric and antioxidant responses, whereas maceration produced the highest gravimetric yield. The lower responses at 80–90% amplitude are an observed association; the present data do not establish degradation, heating-induced loss, oxidation, or any other mechanism. GC–MS tentatively assigned 47 compounds in the 70% extract, but these assignments do not establish antioxidant activity or synergism. Future work should report calibrated acoustic power, temperature profiles, replicate-level statistical analyses, and targeted chemical validation before claiming a mechanistic optimum.
The authors acknowledge the Department of Fisheries, Faculty of Agriculture, Universitas Gadjah Mada, for supporting this research and providing laboratory facilities for the analysis. This article is part of the first author’s thesis
This research received no specific grant from any funding agency in the public, commercial or not-for-profit sectors.
The authors declare that they have no conflicts of interest.
Ethical approval was not applicable.
The data that support the findings of this study are available in the article. Further details may be obtained from the corresponding author upon request.
AI tools were used for language editing, grammar correction, and improving the readability and structure of this manuscript in accordance with the journal's policy. No AI tools were used to generate data, fabricate references, or create figures/tables.

This work is licensed under a
Creative Commons Attribution 4.0 International License
.
You are free to share and adapt this material for any purpose, even commercially, as long as you give appropriate credit.
 access